
Using the Report Grid
The Report Grid is the default destination and results panel for the Data Explorer.
It is easily customised to display the information that you need. It includes the:
- Group Header Panel which allows you to group like data together.
- Results panel which displays the results of your query.
- Footer panel which displays the group totals and grand totals.
- Filter criteria panel which displays any filters that have been applied to the query.
Employee Queries
For all Data Explorer queries using Employee as the Query Type, you may use the Drill Down function.
This means that you can double click on each employee (i.e. anywhere on the employee line) to open their Employee Details screen.
Note: although the query result may include all relevant employees from all your companies, if all companies are selected, the drill down function is active for employees of the current company only.
An Access Denied message is displayed if you double click on a line for an employee within another company, i.e. not the currently logged into company .
Customising the Report Grid:
Adding and Removing Columns:
- Set up your query by selecting the query type, selections and criteria.
- Select Report Grid as your destination.
- Click on Run Query to return results.
- Click on the Choose Fileds icon in the toolbar

The Customization pop up will appear giving you a list of fields/columns that you can choose from. - Click on the field/s that you wish to add to the report grid and, holding the left mouse button down, drag it up to the position that you require it in the headers.
release the mouse button when you see two green arrows in the position you want.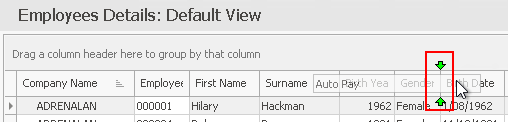
Repeat this for all the fields you wish to add. - You can remove any unwanted columns by clicking on the field in the headers and dragging it back into the Customization screen.
- Click Run Query.
Grouping Columns:
The Query Types often have default groupings which will display in the Group Header Panel. You can add a further level of grouping if required:
- Set up and run your query
- Select the Header by which you want to group the data and drag it up into the Group Header Panel, positioning it at the level you want it to appear.
For example you might want to group a Wage Analysis query by Company /Department/ Month.
This would display wages data for a chosen company, divided up into the company departments.
The data for each department would be divided into months.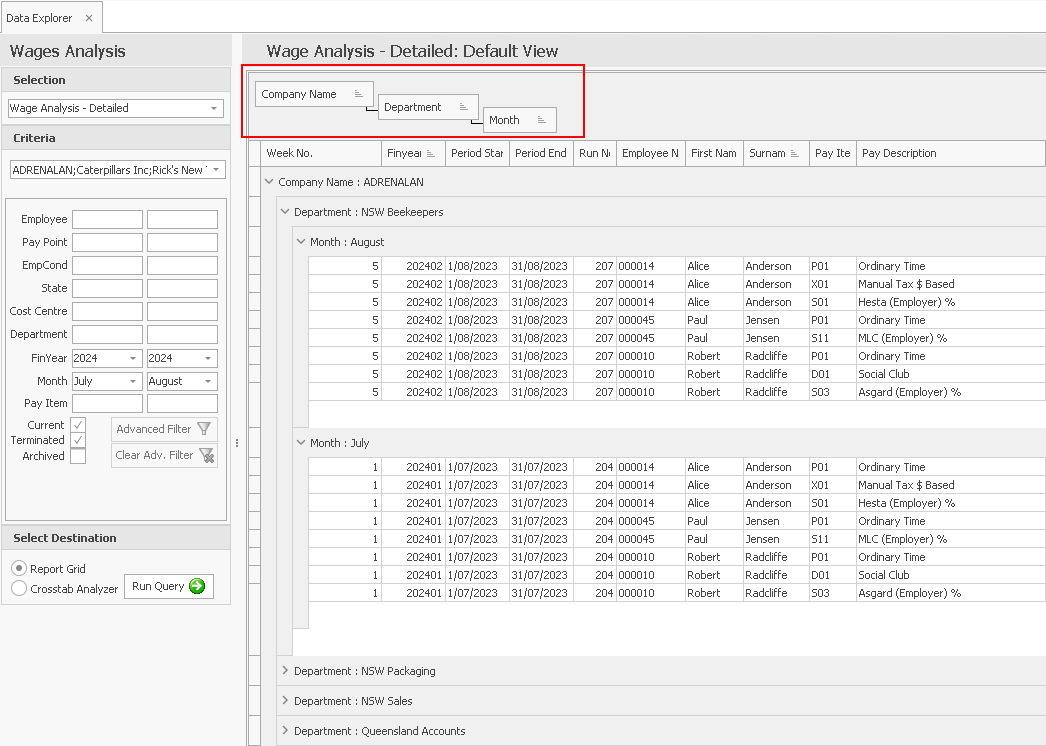
Customising by right clicking on a header:
You can customise individual columns by right clicking on its header.
When you do this a menu will pop up giving you several customisation options:
| Column Customisation | Explanation |
|
|
|
|
Returns the data to its original order. |

|
Will group the entire report by the chosen field. |
|
Hides the Group panel. |

|
Toggles the Footer panel on/off. |

|
Groups the footer selections for comparison purposes. |
| Remove This Column | Removes the column from the grid. |
|
|

|
Will size the chosen column to the size of its widest entry. |
| Best Fit (all columns) |
|

|
Allows a quick search for data instead of filtering. |
Customising by totalling columns:
You can total individual columns by right clicking on its footer.
When you do this a menu will pop up giving you several options:
- For a numerical column: Sum, Min, Max, Count, Average and None.
- For a string or text column: Count and None.